
A Market-Based Solution to Housing Affordability
Re-Anchoring Entry-Level Purchase Prices via Multi-Year Seller Tax Deductions, Novel Bond Financing, and Comparable-Sale Isolation
This paper proposes re-anchoring entry-level purchase prices through multi-year seller tax deductions, novel bond financing, and comparable-sale isolation.
Abstract
For over five decades, American housing policy has attempted to solve the housing affordability crisis by expanding buyer credit leverage and imposing supply-side tax surcharges on investors. Empirical evidence indicates that both strategies fail: credit expansion inflates asset prices, while investor tax hikes trigger a direct pass-through effect, increasing rental burdens on working families.
State-managed shared equity models—such as Hawaiʻi’s Shared Appreciation Equity (SAE) administered by the Hawaiʻi Housing Finance and Development Corporation (HHFDC) and the Reserved Housing Program administered by the Hawaiʻi Community Development Authority (HCDA)—while well-intentioned, inadvertently function as carrying-cost traps. In these programs, buyers bear 100% of mortgage interest, property taxes, and escalating HOA fees while the SAE programs extract net equity upon resale.
This paper presents a market-driven alternative: a Direct Seller Price Markdown Tax Deduction. Under this policy, state governments grant existing property owners a multi-year state income tax deduction in exchange for contractually lowering selling prices to qualified first-time buyers in targeted workforce communities (Priority Housing Zones).
To bridge short-term tax revenue gaps without expanding general obligation debt, the policy introduces a novel public finance instrument: the Tax-Exempt Construction Revenue Backstop Bond. Unlike traditional infrastructure bonds or property-tax TIFs, this hybrid instrument securitizes state general funds by capturing the immediate W2 trade payroll and excise tax increments generated during active residential construction, redevelopment, and housing modernization.
Program integrity and neighboring property values are protected through a dual MLS and Appraisal Firewall embedded in local Multiple Listing Services and the Federal Housing Finance Agency’s Uniform Appraisal Dataset (UAD 3.6 / MISMO 3.6). By isolating markdown sales into a distinct transaction class, the policy preserves neighboring property equity and eliminates NIMBY resistance.
Finally, because the deduction amortizes over 5 years, it incentivizes sellers to maintain primary state tax residency, serving as a demographic retention engine against working-age and retirement-age population flight.
I. The Decoupling Crisis: Why Supply-Side Tax Penalties Fail
By challenging the orthodox belief that we can tax or debt-finance our way out of a housing crisis, a market-driven model emerges: offering existing homeowners multi-year tax deductions to directly cut contractual selling prices for first-time buyers.
For more than five decades, American housing policy has operated under a fiscally fatal assumption: the belief that housing affordability can be achieved by helping buyers carry larger burdens of debt.
When housing values surge, local and state governments are limited by the same restrictive playbook. They raise property tax rates on non-owner-occupied investment properties, impose non-resident surcharges, or levy speculative transaction taxes. The theoretical rationale sounds clean in a legislative brief: penalize investors, discourage speculative flipping, slow the pace of comparable sales ("comps"), and raise municipal revenue to fund housing initiatives.
The real-world result is drastically different.
Academic and market data on non-owner-occupied property tax hikes demonstrate that recurring tax increases on investment properties rarely force baseline home prices down. Instead, they trigger an immediate pass-through effect: landlords shift the added tax burden directly onto renters via higher monthly payments. Rather than making homes cheaper for prospective buyers, investor tax hikes compress rental inventory, increase tenant housing distress, and unintentionally supplement regional government general funds.
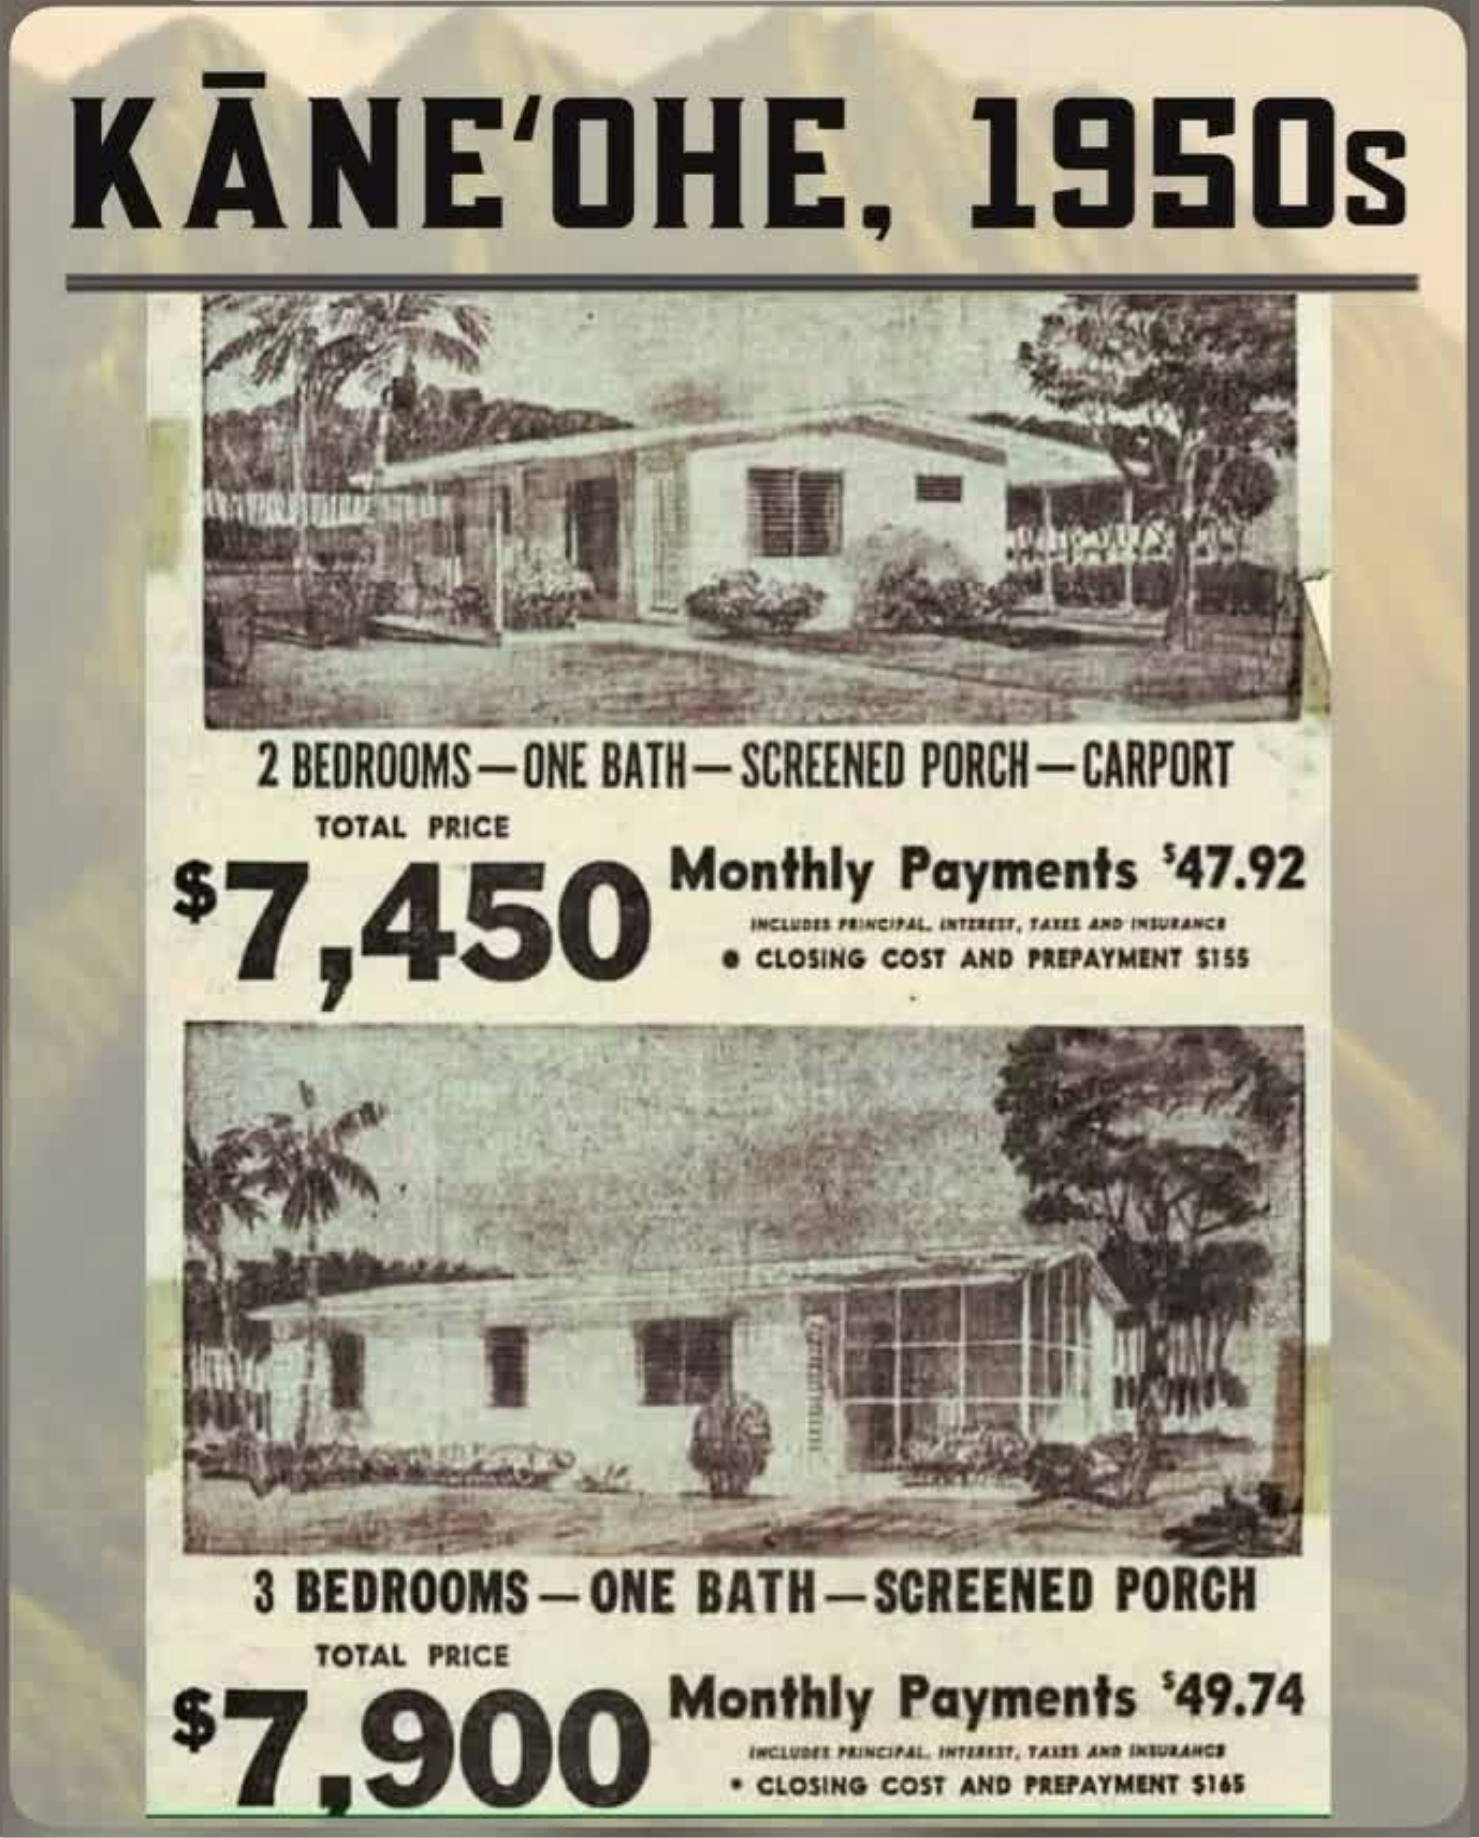
To appreciate how drastically the structural relationship between labor and shelter has eroded, one need only examine archival real estate records from mid-century island communities. In 1950s Kāneʻohe, Hawaiʻi, archival property offerings reveal that a local worker earning a median annual salary of $3,538 could purchase a brand-new, two-bedroom single-family home featuring a screened porch and carport for a total purchase price of $7,450—requiring a monthly mortgage payment of $47.92. A three-bedroom model in the same subdivision sold for $7,900, with monthly carrying costs of $49.74.
[ Infographic 1: 1950s Kāneʻohe real estate baseline ]
At a price-to-income multiple of 2.1x to 2.2x annual earnings, mid-century housing was anchored directly to the local wage structure. A single median income was sufficient to secure fee-simple homeownership while keeping total debt service below 17% of gross monthly earnings.
Today, in metro markets like Oahu, the median single-family home price has surged past $1,050,000 against a median household income of approximately $98,000. The price-to-income multiple has exploded from 2.1x to over 10.7x annual earnings.
On a national scale, the trend is equally severe: between 1970 and today, inflation-adjusted U.S. household incomes grew by approximately 61% (creeping from ~$50,000 to ~$80,600), while median home prices surged by over 114% (soaring from ~$200,000 to over $428,600 nationally, and exceeding $850,000 to $1,000,000+ in high-cost coastal enclaves).
The root cause of the crisis is not a lack of taxes; it is a structural decoupling of asset prices from human wages.
Every conventional government intervention—whether 40-year mortgages, down-payment assistance grants, or low-income housing tax credit (LIHTC) bond initiatives—attempts to bridge this gap by stretching buyer leverage upward toward hyper-inflated asset values. They treat a price problem with a debt bandage.
To genuinely restore affordability, policy must stop trying to inflate buyer purchasing power to match absurd market comps. The contractual selling price of housing must come down. And the fastest way to lower prices is to incentivize the only stakeholders who hold legal authority over the price tag: existing homeowners and property sellers.
[ Infographic 2: 1970–2026 macro decoupling ]
| Year | Median household income (USD) | Median house sales price (USD) | Price-to-income ratio |
|---|---|---|---|
| 1950 | $3,319 | $7,354 | 2.22 |
| 1960 | $5,620 | $11,900 | 2.12 |
| 1970 | $9,867 | $23,475 | 2.38 |
| 1980 | $21,020 | $64,750 | 3.08 |
| 1985 | $23,620 | $82,800 | 3.51 |
| 1990 | $28,838 | $123,900 | 4.30 |
| 1995 | $32,140 | $130,000 | 4.04 |
| 2000 | $40,551 | $165,300 | 4.08 |
| 2005 | $44,097 | $232,500 | 5.27 |
| 2010 | $49,578 | $222,900 | 4.50 |
| 2015 | $53,600 | $289,200 | 5.40 |
| 2020 | $68,400 | $329,000 | 4.81 |
| 2025 | $83,730 | $426,800 | 5.10 |
II. The Accidental Shared Appreciation Trap: HHFDC, HCDA, and the Carrying-Cost Asymmetry
When state governments intervene directly in entry-level housing prices, they frequently deploy Shared Appreciation Equity (SAE) or Reserved Housing covenants. In Hawaiʻi, these programs are administered across distinct jurisdictions by two primary state agencies:
- Hawaiʻi Housing Finance and Development Corporation (HHFDC): Authorized under Chapter 201H, Hawaiʻi Revised Statutes (HRS), HHFDC administers the statewide Shared Appreciation Equity (SAE) program for its own for-sale affordable housing developments. Under HHFDC rules, homeowners agree to share a fixed percentage of net appreciation back with the State upon selling, transferring, renting, or refinancing the property, or via an early payoff calculation based on appraised Fair Market Value (FMV).
- Hawaiʻi Community Development Authority (HCDA): Governed by Title 15, Hawaiʻi Administrative Rules (HAR Chapter 218), HCDA manages its own independent Reserved Housing Program across urban renewal districts such as Kakaʻako and Kalaeloa. HCDA sets independent shared appreciation terms and allows homeowners to prepay shared equity obligations under specific administrative amendments (such as the 2021 HAR §15-218 rules). (Note: In specific historical instances, such as older reserved housing projects, HCDA contracted HHFDC to serve as its administrative buyback or resale agent, but each agency fundamentally maintains independent jurisdiction over its program rules).
While these well-intentioned programs lower initial purchase hurdles for households earning between 80% and 140% Area Median Income (AMI), they introduce a severe carrying-cost asymmetry that inadverdantly positions working-class buyers as temporary asset managers for municipal housing funds.
Consider the financial reality confronting an SAE/Reserved Housing buyer over a 10-year holding period:
- Front-Loaded Interest: During the first decade of a standard 30-year amortization schedule, monthly debt service is dominated by bank interest, yielding minimal principal reduction.
- Escalating HOA & Maintenance Overhead: High-density urban condo towers carry steep, constantly rising HOA dues—compounding at 5% to 8% annually. Over a decade, a buyer pays $120,000 to $180,000+ in non-equity maintenance charges simply to maintain the state-restricted asset.
- Unilateral Equity Extraction: When the owner sells or prepays shared equity under HHFDC/HCDA rules, the state calculates its percentage share against gross appreciation derived from an independent appraisal.
The SAE program extracts its percentage cut off the top. The buyer receives zero deduction or credit for the hundreds of thousands of dollars spent on mortgage interest, HOA dues, property taxes, or capital maintenance over that decade.
When interest paid, HOA fees, and closing costs are subtracted, a reserved housing buyer’s net equity gain is often negative relative to their total capital outlay.
Because un-restricted market-rate homes in the surrounding community continue to appreciate, the now SAE seller is financially limited from stepping up into fee-simple housing. They are often effectively locked into state-restricted inventory or forced back into renting.
[ Infographic 3: 10-year carrying cost asymmetry ]
III. The Policy Mechanism: Multi-Year Seller Income Tax Deductions
To achieve genuine price relief without creating state equity encumbrances, policy must incentivize existing property owners—the price-makers—to contractually lower listing prices.
Instead of funding complex state equity administration or developer tax credits that do not reduce buyer contract prices, state legislatures would enact a Direct Seller Price Markdown Tax Deduction.
1. Structural Design and Amortization
Under this framework, a property owner who contractually agrees to sell a property below its appraised Fair Market Value to a qualified primary buyer receives a dollar-matched state income tax deduction equal to the price markdown.
Using clear, standardized baseline numbers:
- Appraised Fair Market Value (FMV): $1,000,000
- Direct Contractual Markdown: -$250,000
- Recorded MLS Contract Sale Price: $750,000
To protect state treasuries from sudden single-year fiscal shocks, the $250,000 tax benefit is structured as a multi-year income tax deduction amortized over 5 tax years ($50,000 per year). For long-term property owners, downsizing retirees, or real estate investors seeking to liquidate assets, an annual $50,000 deduction offers a predictable tax shield against active income, capital gains, or retirement distributions—providing a clear financial rationale to list at $750,000 rather than $1,000,000.
2. Differentiating Price Markdowns from Fannie/Freddie "Seller Credits"
This policy must not be confused with traditional seller concessions. Under Fannie Mae, Freddie Mac, and FHA guidelines, "Interested Party Contributions" (IPCs)—commonly referred to as seller credits—are capped at 3% to 9% of the purchase price and are restricted strictly to closing costs and temporary interest rate buydowns. Standard IPCs cannot be applied to down payments or used to alter the underlying contract price.
The proposed policy is not an IPC. It is a direct, permanent reduction of the recorded purchase price.
When a home appraises at $1,000,000, the seller signs a legally binding purchase agreement at $750,000. The transaction closes, records on the MLS, and registers in public land records at $750,000. This directly reduces the buyer's down payment requirement, slashes their monthly mortgage obligation, lowers their baseline property tax assessment, and provides immediate fee-simple homeownership.
3. Front-End Protection: The MLS Firewall
To ensure that a contractual markdown to $750,000 does not artificially distort market metrics or depress open-market valuations for surrounding home sales, local Multiple Listing Services (MLSs) and REALTOR® associations introduce a mandatory MLS Firewall.
Under this mechanism, participating local MLS systems create a distinct, independent transaction class tag:
MLS Transaction Category: Incentivized_Direct_Markdown / IDM
Comparative Market Analysis (CMA) software, broker databases, and automated valuation models (AVMs) used by real estate platforms filter out these sales when calculating open-market comps for neighboring properties.
By isolating the transaction at the listing level, the MLS Firewall guarantees that neighbor equity remains completely protected long before an appraisal is commissioned.
[ Infographic 4: The multi-year seller deduction model ]
IV. Program Integrity: The Triple Safeguard Framework
To prevent institutional abuse, tax-shelter manipulation, or private equity arbitrage, the program operates under three strict regulatory guardrails:
- The 3-Year First-Time Buyer Rule: Eligibility is restricted exclusively to buyers meeting the IRS, Fannie Mae, and Freddie Mac First-Time Homebuyer definition—individuals or households with zero ownership interest in a primary residence during the preceding 3-year period—combined with local household income caps (≤ 120% AMI). This completely blocks institutional private equity, speculative flippers, or multi-property owners from capturing discounted properties.
- Priority Housing Zone (PHZ) Geographic Targeting: Modeled on federal Opportunity Zones (QOZ) and HUD Qualified Census Tracts (QCT), program eligibility is restricted to designated ZIP codes where median household incomes align with workforce populations (≤ 120% AMI) and property valuations do not exceed 125% of local HUD median single-family purchase prices. Sellers in luxury or resort ZIP codes cannot claim tax write-offs, preventing affluent households from converting affordable housing incentives into private tax shelters.
- Fair Housing & HMDA Compliance: To eliminate subjective seller steering or discriminatory buyer selection under the Fair Housing Act, buyers are qualified through objective, standardized state housing authority rosters. Transactions are logged under mandatory Home Mortgage Disclosure Act (HMDA) reporting fields, ensuring total auditability and federal regulatory oversight.
[ Infographic 5: Triple safeguard firewall ]
V. The Demographic Retention Engine: Tax Base "Stickiness" & The UHERO Out-Migration Hedge
Demographic Baseline & The Out-Migration Challenge
An important ancillary benefit of structuring this policy as an amortized state income tax deduction is its function as a population retention engine.
High-cost states across the nation—and Hawaiʻi in particular—are experiencing severe demographic contraction. According to economic analysis released by the University of Hawaiʻi Economic Research Organization (UHERO), Hawaiʻi’s working-age population (ages 19–64) contracted from a peak of nearly 850,000 in the mid-2010s to approximately 800,000 today.
UHERO Executive Director Dr. Carl Bonham projects that without immediate structural policy intervention, Hawaiʻi faces two divergent demographic futures: either population contraction flattens near 790,000 working-age residents, or accelerates downward below 740,000 by 2035.
Which path unfolds depends on whether state policy can achieve economic diversification, real wage growth, and a rapid expansion of affordable housing supply concurrently.
[ Infographic 6: Hawaiʻi working-age population trajectory ]
The Tax Residency Anchor Mechanism
The Multi-Year Seller Tax Deduction addresses this demographic drain by establishing a Tax Residency Anchor:
- Mitigating Capital Flight: Under traditional market dynamics, when long-term homeowners liquidate equity, they frequently export their capital to zero-income-tax states (such as Nevada, Texas, or Florida) to avoid state income and capital gains taxes. This capital flight accelerates demographic decline and strips the state of high-earning taxpayers.
- Anchor Mechanics: Because the tax deduction is issued at the state level and amortizes across 5 tax years, a seller can only monetize the benefit if they remain a primary tax resident of that state. If a seller relocates out of state post-sale, their state tax liability drops to zero, forfeiting remaining deduction years.
- Retaining Local Capital: By offering a substantial annual tax shield ($50,000 per year against state income, retirement distributions, or active earnings), the state provides a financial incentive for downsizing retirees and local business owners to stay in-state.
This policy converts real estate transactions from drivers of capital flight into multi-year residency anchors, preserving the state tax base while providing the workforce housing supply required to slow population decline.
[ Infographic 7: The multi-year residency anchor mechanism ]
VI. Securitizing the Gap: Introducing the "Construction Tax-Increment Backstop Bond"
State treasurers will naturally raise a core fiscal question: How does the state absorb short-term income tax revenue reductions without compromising municipal operating budgets?
The solution requires establishing a novel public finance framework: the Tax-Exempt Construction Revenue Backstop Bond. While standard municipal bonds rely on ad valorem property taxes or general obligation debt, this specialized instrument functions as a novel, off-general-fund Payroll and Sales Tax-Increment Revenue Bond.
1. Securitizing the Amortized Tax Gap
Because the seller's $250,000 tax deduction is amortized over 5 tax years ($50,000 per year), the state's revenue foregone in any single fiscal year is predictable and modest. To bridge this timing gap, state housing finance agencies issue low-yield, tax-exempt Municipal Revenue Backstop Bonds.
Unlike traditional infrastructure bonds that fund physical sitework or general obligation (GO) bonds that pledge the full faith and credit of the state, these revenue backstop bonds securitize the state general fund against the temporary yield difference. They do not expand general obligation debt or create long-term taxpayer liabilities.
2. Construction as an Immediate Fiscal Engine
The bond debt service is serviced by a dedicated, self-funding revenue stream: the incremental state tax revenue generated when residential housing supply is built, expanded, renovated, or modernized within designated Priority Housing Zones (PHZs).
Municipalities often view housing through the narrow lens of property tax collections. In reality, active residential construction, redevelopment, and housing modernization act as immediate income-tax engines that convert underutilized land into active tax-generating assets:
- W2 Payroll Tax Capture: Constructing workforce housing or modernizing existing residential structures requires high-wage skilled labor—electricians, plumbers, carpenters, masons, and civil engineers. Every paycheck issued on a residential site triggers immediate state W2 income tax withholdings from day one of construction.
- General Excise & Sales Tax Multipliers: The procurement of building materials—lumber, concrete, steel, roofing, electrical hardware, and HVAC systems—generates an immediate surge in General Excise Tax (GET) and state sales tax receipts.
- Converting Dormant Parcels into Fiscal Engines: Vacant, unimproved, or underutilized residential parcels produce minimal tax yield on county rolls. The moment ground is broken for housing development, the parcel transitions into an active revenue engine, generating trade payroll taxes today and long-term fee-simple property taxes tomorrow.
The revenue generated by active trade labor and material procurement flows directly into the state treasury, providing the exact tax-increment revenue stream required to service the Backstop Bond while the seller's multi-year tax deduction amortizes.
[ Infographic 8: The closed-loop municipal financing engine ]
VII. The Existential NIMBY Hedge: Dual MLS and Appraisal Comp Firewall Isolation
The final hurdle to any affordable housing policy is political and psychological: NIMBY (Not In My Back Yard) resistance.
Existing homeowners frequently oppose affordable housing initiatives out of a rational financial concern: if a neighboring home sells at a deep discount, homeowners fear appraisers and real estate algorithms will use that transaction as a direct comparable sale, dragging down the appraised Fair Market Value of their own property and eroding their home equity.
To eliminate NIMBY resistance at its root, the proposed policy establishes a Dual MLS and Appraisal Comp Firewall that operates across both real estate valuation layers:
1. Front-End Protection: The MLS Comp Classification
At the listing and market analysis level, local REALTOR® MLS databases classify participating sales under a distinct transaction class (Incentivized_Direct_Markdown).
Comparative Market Analysis (CMA) algorithms used by agents and Automated Valuation Models (AVMs) used by public real estate portals automatically exclude these transactions when estimating standard open-market values.
Neighboring property owners see zero artificial decline in public market estimates.
2. Back-End Protection: The UAD 3.6 Appraisal Firewall
At the formal underwriting level, the policy embeds into the Federal Housing Finance Agency’s (FHFA) Uniform Appraisal Dataset (UAD 3.6 / MISMO 3.6) framework:
Transaction Class Tag: Incentivized_Direct_Markdown / Qualified_Primary_Buyer
Under updated Uniform Standards of Professional Appraisal Practice (USPAP) and GSE guidelines, clear appraisal rules apply:
- Isolation Rule: Appraisers conducting valuations for standard, unassisted market-rate properties are explicitly prohibited from using "Incentivized Direct Markdown" sales as direct comparable sales on appraisal grids.
- Adjustment Rule: In low-density markets where an appraiser must use an Incentivized Markdown sale due to a lack of proximate comps, USPAP guidelines mandate an explicit, positive line-item adjustment equal to the verified state tax deduction amount (+$250,000), restoring the subject property's baseline Fair Market Value.
By legally protecting existing home values at both the MLS and appraisal levels, the policy dismantles the primary economic fear driving NIMBYism, turning neighborhood homeowners into supportive stakeholders.
[ Infographic 9: Dual MLS and appraisal comp firewall ]
VIII. Conclusion and Policy Recommendations
The crisis of housing affordability in America cannot be solved by creating longer mortgage terms or penalizing property investors with taxes that trickle down as higher rents. Real affordability requires lower baseline purchase prices.
By replacing state shared-equity liens with a Multi-Year Seller Income Tax Deduction, public policy aligns market incentives with civic outcomes:
Sellers receive multi-year tax relief and a predictable financial incentive to maintain primary state tax residency.
Qualified First-Time Buyers secure unencumbered fee-simple homeownership, aligning long-term debt service with local earnings.
State Treasuries backstop short-term tax deduction yield gaps through novel Tax-Exempt Construction Revenue Backstop Bonds, debt-serviced by the immediate W2 payroll and sales tax engine of active residential construction, redevelopment, and housing modernization.
Neighboring Property Owners retain 100% equity protection through the dual MLS and UAD 3.6 appraisal comp firewall.
State legislatures would enact Direct Seller Price Markdown legislation, authorize the issuance of Construction Revenue Backstop Bonds, coordinate with local REALTOR® MLS boards and the FHFA to establish Incentivized_Direct_Markdown transaction tags, and shift public housing policy from debt-expansion programs toward direct seller price incentives.
References & Sources
Acknowledgments & Methodological Note: During the preparation of this work, the author utilized generative AI tools to assist in literature synthesis, manuscript structuring, and formatting data tables. Following the use of these tools, the author reviewed, edited, and verified all content for economic logic, statutory accuracy, and technical consistency, and takes full responsibility for the content and conclusions of the publication.
1. Peer-Reviewed Academic Literature & Working Papers
- Baker, S. (2025). Property tax pass-through to renters: A quasi-experimental approach. Federal Reserve Bank of Philadelphia Working Paper Series, WP25-41. https://www.philadelphiafed.org/-/media/frbp/assets/working-papers/2025/wp25-41.pdf
- England, R. W. (2016). Tax incidence and rental housing: A survey and critique of research. National Tax Journal, 69(2), 435–460. https://doi.org/10.17310/ntj.2016.2.07
- Han, L. (2025). To own or to rent? The effects of transaction taxes on housing markets. The Review of Economic Studies, 93(4), 2605–2635. https://academic.oup.com/restud/article/93/4/2605
2. Federal Economic, Census & Macroeconomic Datasets
- Federal Reserve Bank of St. Louis (FRED). Median Sales Price of Houses Sold for the United States (MSPUS). Federal Reserve Economic Data. https://fred.stlouisfed.org/series/MSPUS
- Federal Reserve Bank of St. Louis (FRED). Nominal Median Household Income in the United States (MEHOINUSA646N). Federal Reserve Economic Data. https://fred.stlouisfed.org/series/MEHOINUSA646N
- U.S. Census Bureau. Historical Income Tables: Households (Table H-6: Income Distribution of Households). Social, Economic, and Housing Statistics Division. https://www.census.gov/data/tables/time-series/demo/income-poverty/historical-income-households.html
- U.S. Census Bureau. Historical Decennial Census Housing Value Tables (COH Values). Housing and Household Economic Statistics. https://www.census.gov/data/tables/time-series/dec/coh-values.html
3. Institutional Housing Research & Urban Policy Institutes
- Harvard University Joint Center for Housing Studies (JCHS). The State of the Nation's Housing 2024. President and Fellows of Harvard College. https://www.jchs.harvard.edu/state-nations-housing-2024
- Lincoln Institute of Land Policy. Land and Single-Family Home Values Across the United States Data Toolkit. Lincoln Institute Research Data. https://www.lincolninst.edu/research-data/data-toolkits/land-and-single-family-home-values-across-the-united-states/
4. State of Hawaiʻi Authorities & Regional Economic Forecasts
- Hawaiʻi Community Development Authority (HCDA). Kakaʻako Reserved Housing Program Rules and Guidelines (HAR Title 15, Chapter 218). Department of Business, Economic Development & Tourism (DBEDT), State of Hawaiʻi. https://dbedt.hawaii.gov/hcda/reserved-housing/
- Hawaiʻi Housing Finance and Development Corporation (HHFDC). Shared Appreciation Equity (SAE) Program Obligations and Administrative Rules (HRS Chapter 201H). Department of Business, Economic Development & Tourism (DBEDT), State of Hawaiʻi. https://dbedt.hawaii.gov/hhfdc/
- University of Hawaiʻi Economic Research Organization (UHERO). State of Hawaiʻi Economic Forecast and Demographic Trends Report. Executive Director Dr. Carl Bonham. https://uhero.hawaii.edu
- Kāneʻohe Historical Real Estate Archives (1950s). Mid-Century Subdivision Offerings, Wage Ratios, and Housing Advertisements. Hawaiʻi Real Estate & Community Archives.
5. Federal Mortgage, Appraisal, Public Finance & MLS Data Standards
- Federal Housing Finance Agency (FHFA). Uniform Appraisal Dataset (UAD) Specification and MISMO 3.6 Data Standards. Fannie Mae & Freddie Mac. https://www.fhfa.gov/DataTools/Pages/UAD.aspx
- Fannie Mae. Single-Family Selling Guide: B3-4.1-02, Interested Party Contributions (IPCs). Fannie Mae Policy Standards. https://selling-guide.fanniemae.com/sel/b3-4.1-02/interested-party-contributions-ipcs
- Internal Revenue Service (IRS). 26 U.S. Code § 72(t)(8)(D) — Definition of First-Time Homebuyer for Qualified Distributions. Legal Information Institute / IRS Tax Code. https://www.law.cornell.edu/uscode/text/26/72
- Real Estate Standards Organization (RESO). RESO Data Dictionary Specification & Listing Transaction Status Standard. https://www.reso.org/data-dictionary/
- Municipal Securities Rulemaking Board (MSRB). Tax-Exempt Municipal Revenue Security & Tax-Increment Rule Frameworks. Securities and Exchange Commission Regulation. https://www.msrb.org